cfchartタグ Tips
ColdFusion 11よりwebchart3Dは廃止されたため、cfchartタグで出力されるチャートが変わりました(別のトピック「cfchartでサーバー生成チャートのエンジンが変更されました」でも説明している通り、サーバー生成チャートでもZingchartベースで画像が生成されるようになりました)。
このトピックでは、チャートのスタイルや表示を変更する参考情報を紹介していきます。
【このトピックの記載に関する注意点】
- こちらで確認した限りの情報となります。このトピックで紹介した以外の方法でも同等、または、それ以上に良い方法があるかもしれません。
- 内容については、予告なく追加や変更、削除する場合があります事を予めご了承下さい。
- 特に表記が無い限り、Windows 64bit 版 ColdFusion 11で動作を確認しています。異なるOSでは正しく表示されない場合があります。
- ColdFusion 11 Enterprise 版で確認した動作のため、Standard 版では記載した内容で正しく表示されない、あるいはエラー等が発生する可能性があります。
①グラフの項目や凡例の文字化けを直す
 ⇒
⇒ 
グラフの項目や凡例に日本語が含まれていて文字化けする場合は、<cfchart> の font 属性をセットして下さい。こちらの環境では、font="arialunicodeMS" を指定することで、日本語が表示される事を確認しています。
<cfchart format="jpg" showlegend="true" font="arialunicodeMS" >
	<cfchartseries type="bar" query="qUriage" ... seriesLabel="売上額">
</cfchart>
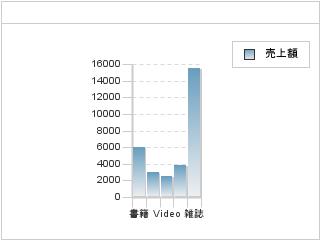
ColdFusion 11 Update 3 以降・2016・2018の環境では、上記のfont属性を指定した後も、一部のグラフで凡例(legend)のみ文字化けが発生します(format="jpg"の時など)。回避方法は、グラフの項目に Font を指定します(凡例の表示が標準と少し異なりますが文字化けは回避できます)。
<cfset stLegend=StructNew()>
<cfset stLegend["item"]["font-family"]="arialunicodeMS">
<cfchart format="jpg" showlegend="true" font="arialunicodeMS" legend="#stLegend#">
	<cfchartseries type="bar" query="qUriage" ... seriesLabel="売上額">
</cfchart>
②pieチャートの始点を変える
 ⇒
⇒ 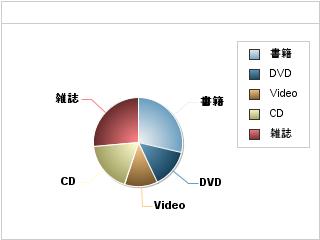
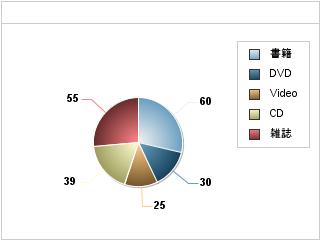
<cfchart> で pie チャートを使用すると、デフォルトの開始位置は右90度から開始されます。これを0度から始めるには、cfchartタグにplot属性を指定してref-angleで角度をセットします。
<cfset stPlot=StructNew()>
<cfset stPlot["ref-angle"]=-90>

<cfchart format="jpg" plot="#stPlot#" font="arialunicodeMS">
	<cfchartseries type="pie">
	  <cfchartdata item="書籍" value="60"/>
	  <cfchartdata item="DVD" value="30"/>
	  <cfchartdata item="Video" value="25"/>
	  <cfchartdata item="CD" value="39"/>
	  <cfchartdata item="雑誌" value="55"/>
	</cfchartseries>
</cfchart>
※plot属性を指定すると、これまで表示されていた項目(雑誌とかDVDとか)が表示されなくなりました。も項目を表示するためには、plot属性にvalue-boxを指定する必要があります。また、上記のコードでは、ref-angleを-90と指定していましたが、項目名を表示したときに最初の項目の表示位置がおかしかったので、ref-angle を 270 に変更しました。
<cfset stPlot=StructNew()>
<cfset stPlot["ref-angle"]=270>
<cfset stPlot["value-box"]["text"]="%t">
<cfset stPlot["value-box"]["color"]="##000000">

<cfchart format="jpg" plot="#stPlot#" font="arialunicodeMS">
	<cfchartseries type="pie">
	  <cfchartdata item="書籍" value="60"/>
	  <cfchartdata item="DVD" value="30"/>
	  <cfchartdata item="Video" value="25"/>
	  <cfchartdata item="CD" value="39"/>
	  <cfchartdata item="雑誌" value="55"/>
	</cfchartseries>
</cfchart>
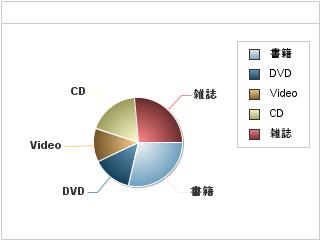
③pieチャートの各項目の表示を値に変更する
⇒ 
これまでColdFusion で pieチャートを表示すると、各項目の値が表示されていましたがColdFusion 11では項目名が表示されます。以前のバージョンと同じく値を表示させるには、②のサンプルで記述している plot属性に割り当てた value-box の text の値を "%t" から "%v" に変更して下さい。
上記②のコードの spPlot["value-box"]["text"]の値を変更して下さい。
<cfset stPlot["value-box"]["text"]="%v">
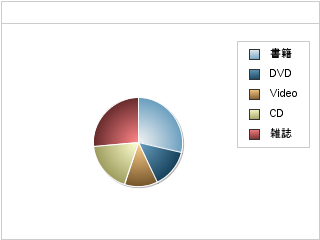
④余白を調整してグラフを大きく表示する
 ⇒
⇒ 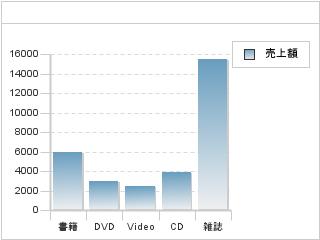
cfchartでグラフを表示した際に、余白が大きく取られてしまう場合があります。余白はcfchartのplotarea属性でmargin-xxxを指定することで調整できます。
<cfset stPlotarea=StructNew()>
<cfset stPlotarea["margin-top"]=30>
<cfset stPlotarea["margin-right"]=0>
<cfset stPlotarea["margin-left"]=50>
<cfset stPlotarea["margin-bottom"]=30>

<cfchart format="html" font="arialunicodeMS" plotarea="#stPlotarea#" >
 <cfchartseries type="bar" seriesLabel="売上額" >
  <cfchartdata item="書籍" value="6000"/>
  <cfchartdata item="DVD" value="3000"/>
  <cfchartdata item="Video" value="2500"/>
  <cfchartdata item="CD" value="3900"/>
  <cfchartdata item="雑誌" value="15500"/>
 </cfchartseries>
</cfchart>
⑤凡例の表示を変更してグラフをさらに大きく表示する
⇒ 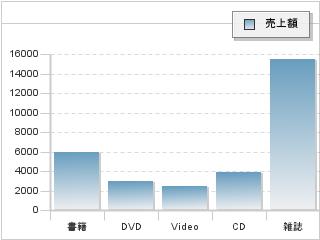
デフォルトでは、棒グラフの凡例(売上額)がグラフに被らないように表示されていますが、上記のようにグラフの右側に余分な余白が広がっているように見えます。凡例の位置を変更してグラフを大きく表示したい場合は、cfchartのlegend属性のpositionで位置を変更します。
<cfset stPlotarea=StructNew()>
<cfset stPlotarea["margin-top"]=30>
<cfset stPlotarea["margin-right"]=0>
<cfset stPlotarea["margin-left"]=50>
<cfset stPlotarea["margin-bottom"]=30>

<cfset stLegend=StructNew()>
<cfset stLegend["position"]="100% 0%">
<cfset stLegend["margin-top"]=10>
<cfset stLegend["margin-right"]=10>
<cfset stLegend["margin-left"]=10>
<cfset stLegend["margin-bottom"]=10>
<cfset stLegend["item"]["font-family"]="arialunicodeMS">

<cfchart format="jpg" font="arialunicodeMS" plotarea="#stPlotarea#" legend="#stLegend#" >
 <cfchartseries type="bar" seriesLabel="売上額" >
  <cfchartdata item="書籍" value="6000"/>
  <cfchartdata item="DVD" value="3000"/>
  <cfchartdata item="Video" value="2500"/>
  <cfchartdata item="CD" value="3900"/>
  <cfchartdata item="雑誌" value="15500"/>
 </cfchartseries>
</cfchart>
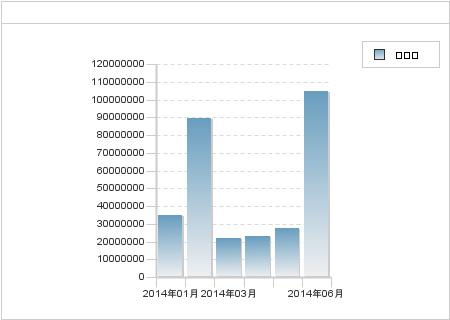
⑥グラフのy軸の数値ラベルをフォーマットする
⇒ 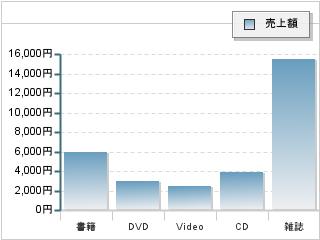
y軸に表示される数値をフォーマットするには、cfchartにyaxis属性を追加し、thousands-separatorをセットします。⑤のグラフのy軸をxxxx円で表示したい場合は、下記のように format と thousands-separatorをセットして下さい。
<cfset stPlotarea=StructNew()>
<cfset stPlotarea["margin-top"]=30>
<cfset stPlotarea["margin-right"]=0>
<cfset stPlotarea["margin-left"]=60>
<cfset stPlotarea["margin-bottom"]=30>

<cfset stLegend=StructNew()>
<cfset stLegend["position"]="100% 0%">
<cfset stLegend["margin-top"]=10>
<cfset stLegend["margin-right"]=10>
<cfset stLegend["margin-left"]=10>
<cfset stLegend["margin-bottom"]=10>
<cfset stLegend["item"]["font-family"]="arialunicodeMS">

<cfset stYAxis=StructNew()>
<cfset stYAxis["format"]="%v円">
<cfset stYAxis["thousands-separator"]=",">

<cfchart format="jpg" font="arialunicodeMS" plotarea="#stPlotarea#" legend="#stLegend#" yAxis="#stYAxis#" >
 <cfchartseries type="bar" seriesLabel="売上額" >
  <cfchartdata item="書籍" value="6000"/>
  <cfchartdata item="DVD" value="3000"/>
  <cfchartdata item="Video" value="2500"/>
  <cfchartdata item="CD" value="3900"/>
  <cfchartdata item="雑誌" value="15500"/>
 </cfchartseries>
</cfchart>
⑦その他、表示サンプル(凡例、値の表示をカスタマイズ)
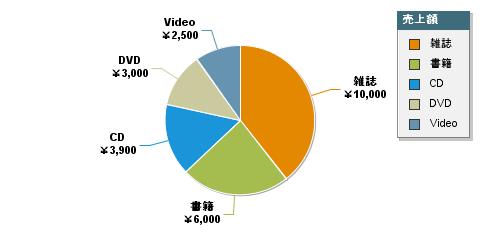
<cfset stPlot=StructNew()>
<cfset stPlot["ref-angle"]=270>
<cfset stPlot["value-box"]["font-family"]="arialunicodeMS">
<cfset stPlot["value-box"]["text"]="%t<br>¥%v">
<cfset stPlot["value-box"]["thousands-separator"]=",">
<cfset stPlot["value-box"]["color"]="##000000">

<cfset stLegend=StructNew()>
<cfset stLegend["item"]["font-family"]="arialunicodeMS">
<cfset stLegend["header"]["font-family"]="arialunicodeMS">
<cfset stLegend["header"]["text"]="売上額">
<cfset stLegend["position"]="100% 0%">
<cfset stLegend["margin-top"]=10>
<cfset stLegend["margin-right"]=10>
<cfset stLegend["margin-left"]=10>
<cfset stLegend["margin-bottom"]=10>

<cfchart format="jpg" font="arialunicodeMS" legend="#stLegend#" plot="#stPlot#" chartwidth="480">
 <cfchartseries type="pie">
  <cfchartdata item="雑誌" value="10000"/>
  <cfchartdata item="書籍" value="6000"/>
  <cfchartdata item="CD" value="3900"/>
  <cfchartdata item="DVD" value="3000"/>
  <cfchartdata item="Video" value="2500"/>
 </cfchartseries>
</cfchart>
⑧その他、表示サンプル(ツールチップ表示をカスタマイズ)
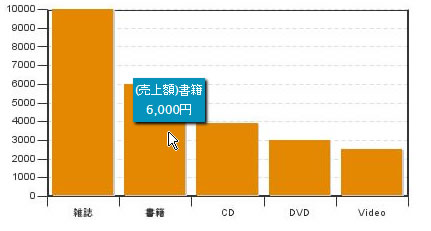
<cfset stPlot=StructNew()>
<cfset stPlot["tooltip"]["text"]="(%t)%k<br>%v円">
<cfset stPlot["tooltip"]["thousands-separator"]=",">
<cfset stPlot["tooltip"]["background-color"]="##0392BB">
<cfset stPlot["tooltip"]["shadow"]=true>
<cfset stPlot["tooltip"]["shadow-alpha"]=1>
<cfset stPlot["tooltip"]["shadow-color"]="##000000">
<cfset stPlot["tooltip"]["shadow-distance"]=2>
<cfset stPlot["tooltip"]["shadow-blur-x"]=1>
<cfset stPlot["tooltip"]["shadow-blur-y"]=1>

<cfchart format="jpg" font="arialunicodeMS" plot="#stPlot#" chartwidth="480">
 <cfchartseries type="bar" seriesLabel="売上額">
  <cfchartdata item="雑誌" value="10000"/>
  <cfchartdata item="書籍" value="6000"/>
  <cfchartdata item="CD" value="3900"/>
  <cfchartdata item="DVD" value="3000"/>
  <cfchartdata item="Video" value="2500"/>
 </cfchartseries>
</cfchart>
⑨ X軸の項目の表示を自動で省略されないようにする (2016.11.17 追加)
 ⇒
⇒ 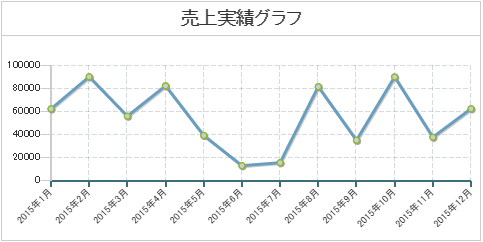
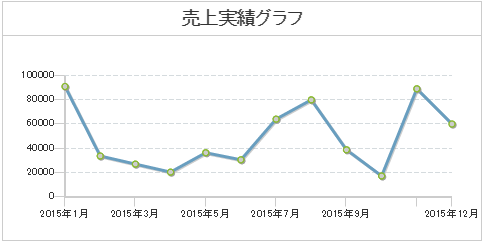
X軸の項目の文字が長い(上記の場合は2015年X月)場合や、表示の大きさが小さかった場合には、自動的に表示する項目が省略されます。表示が省略されないように調整したい場合は、cfchartにxAxis属性を追加して、max-labelsやitems-overlapを指定します。さらに、itemのfont-sizeやangle、max-chars などを指定して、表示する文字の大きさや角度、最大文字数なども指定すると、上記の右グラフのような表示ができます(合わせて④の余白を変更するなど、希望する表示に近づくように調整を行って下さい)。
<cfset stPlotarea=StructNew()>
<cfset stPlotarea["margin-top"]=30>
<cfset stPlotarea["margin-right"]=10>
<cfset stPlotarea["margin-left"]=50>
<cfset stPlotarea["margin-bottom"]=60>

<cfset stXAxis=StructNew()>
<cfset stXAxis["max-labels"]="100">
<cfset stXAxis["items-overlap"]="true">
<cfset stXAxis["item"]["font-size"]="10">
<cfset stXAxis["item"]["angle"]="-45">
<cfset stXAxis["item"]["max-chars"]="20">

<cfchart width="480" font="arialunicodeMS" format="html" title="売上実績グラフ" showLegend="false" xAxis="#stXAxis#" plotarea="#stPlotarea#">
    <cfchartseries type="line">
      <cfloop from="1" to="12" index="i">
        <cfchartdata item="2015年#i#月" value=#RandRange(10000,100000)#>
      </cfloop>
    </cfchartseries>
</cfchart>
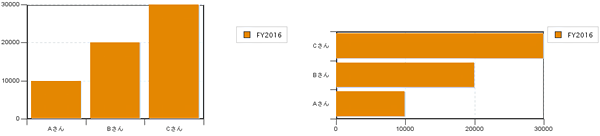
⑩ 横棒グラフの表示順を逆にする (2016.11.21 追加)
↓
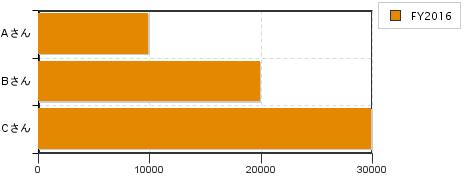
Aさん、Bさん、Cさんの3人の売上を表示している棒グラフを横向きに表示(type="horizontalbar")すると、上の図のように、項目が下から順にAさん、Bさん、Cさんと表示されます。この表示を上から順番に行いたい時は、cfchartにxAxis属性を追加してmirroredを指定します(注意:本来はY軸ですが、horizontalbarの仕様上X軸に対する指定となります)。
下記の例では、合わせてX軸の線の表示を調整しています。
<cfset stXAxis=StructNew()>
<cfset stXAxis["mirrored"]="true">
<cfset stXAxis["line-color"]="##000000">
<cfset stXAxis["line-width"]="1">
<cfset stXAxis["tick"]["line-color"]="##000000">
<cfset stXAxis["tick"]["line-width"]="1">

<cfchart format="png" chartwidth="500" font="arialunicodeMS" showlegend="true" xAxis="#stXAxis#">
  <cfchartseries type="horizontalbar" seriesLabel="FY2016" >
    <cfchartdata item="Aさん" value="10000">
    <cfchartdata item="Bさん" value="20000">
    <cfchartdata item="Cさん" value="30000">
  </cfchartseries>
 </cfchart>
情報
- ZingChart の表示項目について
http://www.zingchart.com/blog/2011/11/16/tokens-in-tooltips-value-boxes-and-more/ - ZingChart Builder
http://www.zingchart.com/builder/
※記事のカテゴリを「ColdFusion 11情報」から「技術情報」に変更しました。
記事公開日:2014年05月13日
最終更新日:2020年07月28日
Sample Modal Window
This is just a sample…
Lorem ipsum dolor sit amet, consectetur adipiscing elit. Praesent suscipit iaculis libero sed tristique. Quisque mollis dolor non tellus placerat vitae sodales lectus porta. Curabitur ut suscipit tellus. Maecenas rhoncus, ante vitae vehicula vestibulum, metus sapien dapibus tellus, et mattis dolor neque vitae nisl. Nullam eleifend ultrices ipsum eget pretium. Curabitur semper metus ut ante adipiscing nec volutpat sem rutrum. Nullam a nisi lacus, non interdum ante. Vivamus ante augue, commodo vel egestas sed, pharetra nec dui. Quisque sed tellus felis. Donec ipsum mauris, sagittis eu accumsan in, aliquam non ipsum.
Vestibulum tempor nunc nec felis scelerisque eget elementum erat dignissim. Ut vel ipsum mollis orci venenatis luctus. Aenean vehicula quam vel quam porttitor ac iaculis elit pulvinar. Proin consequat, ipsum eu venenatis semper, justo turpis posuere tortor, ac placerat metus nisl et lectus. Nulla cursus dui id nunc ullamcorper sed semper nisl lobortis. Aliquam erat volutpat. Phasellus arcu ante, imperdiet in ornare sed, laoreet eu massa.